PPC & Paid Media

One strategy.
Every channel that earns it.

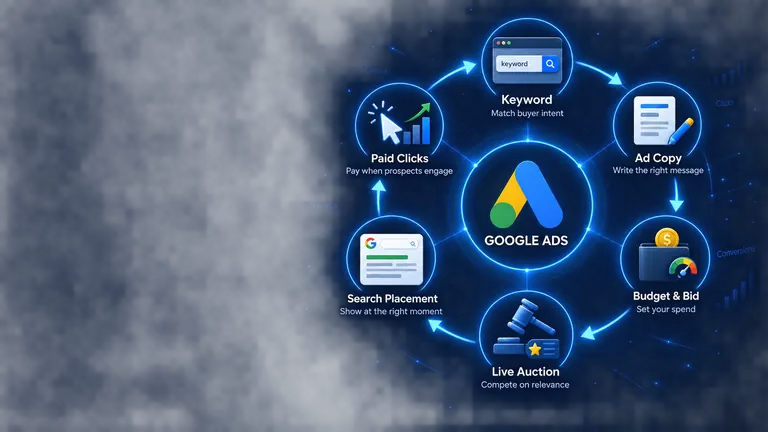
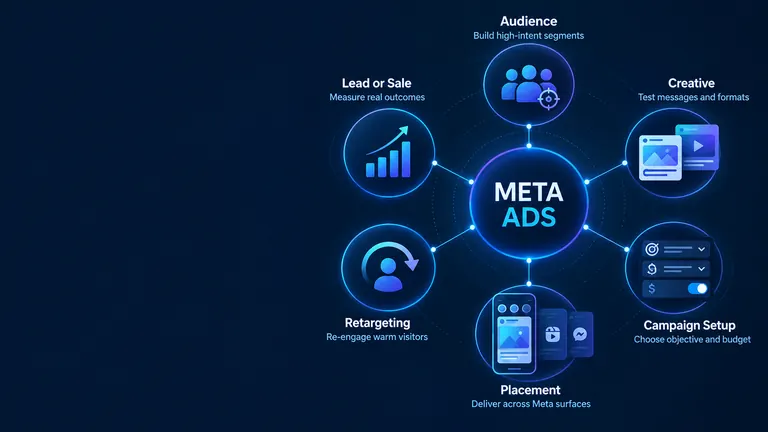
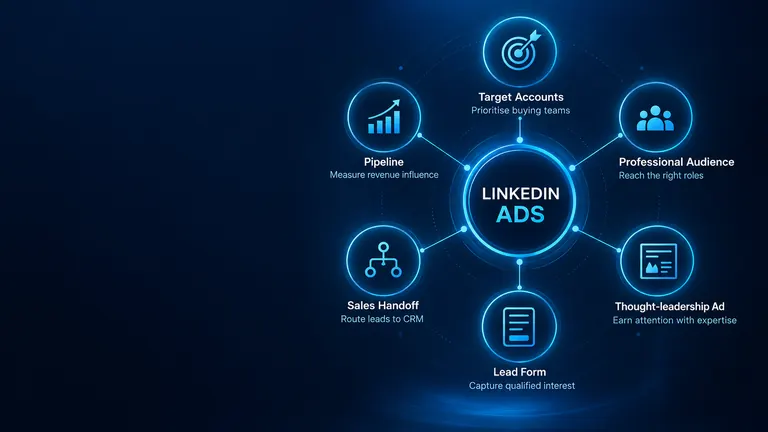
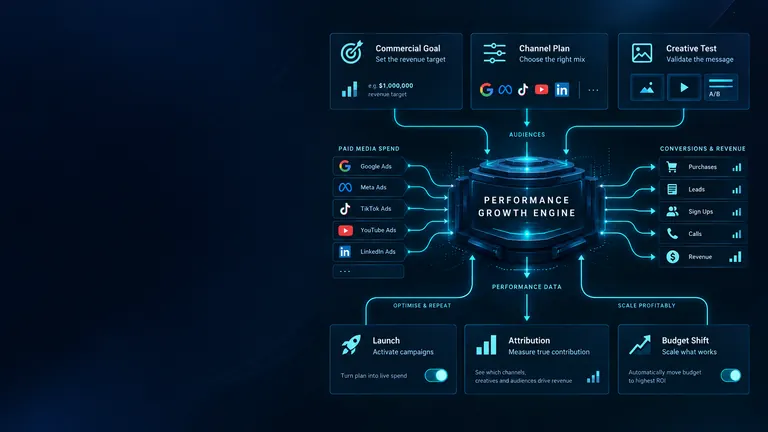
Most PPC and paid media is bought channel by channel, each judged on its own reported numbers. We plan and buy across search, social, display and video against a single commercial target — so budget follows what genuinely works rather than what reports best.

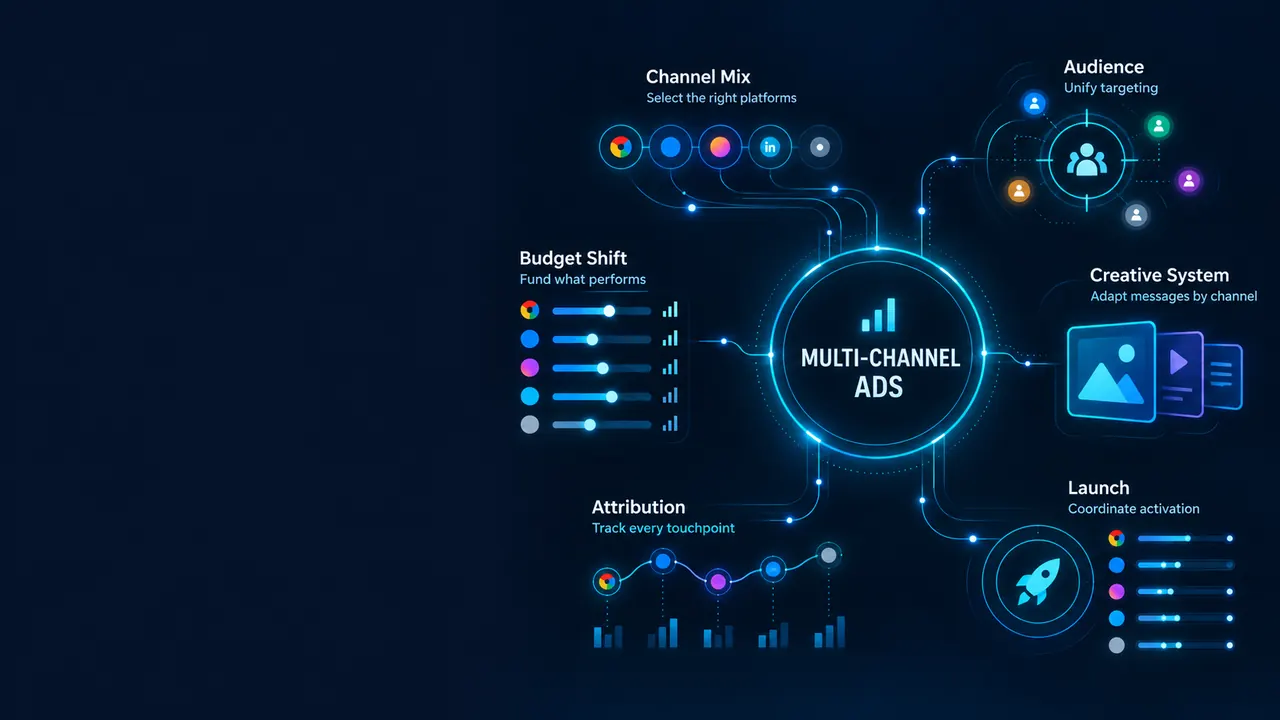
MULTICHANNELSearchSocialDisplayVideoRetargetBLENDED CPA−41%ROAS4.8x
Multi-channel planning
Ad creative
Audience strategy
Blended reporting
01
The siloed-buying problem

Channels bought separately compete with each other and nobody notices

When search, social and display are managed as separate line items, each optimises to its own dashboard. The same customer gets counted three times, budgets get set by last quarter's reported ROAS, and no one is accountable for what the whole programme produced. The result is spend that looks efficient in every individual report and mediocre in the accounts.

Channels claiming the same customer

Search, social and display each count conversions their pixel touched. Summed, the reported total routinely exceeds actual orders, which makes cross-channel budget decisions guesswork.

Creative built once, run forever

Ad performance decays with frequency. Programmes without a testing and retirement cadence pay progressively more for declining attention, and the dashboard shows it as rising costs rather than tired creative.

Audiences overlapping

Separate campaigns frequently target the same people, bidding against each other and inflating your own costs. It is common and almost never audited.

No view of total efficiency

Without a blended target, nobody can say what a customer costs across all advertising — only what each platform claims in isolation.

4.8×
Target blended ROAS achieved
−41%
Typical blended CPA reduction
4+
Channels planned as one
8+
Years buying media
02
What we actually do

Plan centrally. Buy everywhere. Judge on one number.

We start from the commercial target — what a customer can cost and still be profitable — then work backwards to which channels can deliver at that price and what role each plays.

Some channels create demand, some capture it, some retain it. Judging a demand-creation channel on last-click return guarantees it gets cut, which is why programmes that do it end up over-invested in retargeting and starved of new customers.

  • Channel role definition — prospecting, capture and retention distinguished so each channel is measured against the job it is actually doing.
  • Blended efficiency target — one CPA or ROAS across all advertising, tied to real margin rather than platform-reported returns.
  • Creative production & testing — ads built per platform with a standing test programme and retirement rules for fatigued assets.
  • Audience architecture — exclusions and overlaps managed so campaigns stop bidding against each other.
  • Deduplicated reporting — one view of what advertising produced in total, reconciled against revenue in your own systems.
Siloed buying
Planned advertising
Each channel judged alone
One blended target
Conversions counted 3×
Deduplicated reporting
Audiences overlapping
Exclusions managed
Creative runs till it dies
Tested and retired
Budget set by last ROAS
Budget set by margin
Retargeting over-credited
Incrementality tested

The role point: prospecting will always look worse than retargeting on last-click reporting, because retargeting reaches people who already decided. Judge them the same way and you will systematically defund the thing creating your demand.

03
The Sachkhand blueprint

How we build an advertising programme that scales

Six workstreams, measurement and margin first — because a target set from platform numbers rather than profit is the root of most overspending.

01

Margin & target setting

What a customer can cost and remain profitable, accounting for repeat purchase and lifetime value. Every other decision follows from this number.

02

Measurement foundation

Server-side tracking, deduplication and blended reporting so channels can be compared on the same basis rather than on self-reported figures.

03

Channel roles & mix

Which channels create demand, which capture it, which retain it — and what share of budget each warrants given your margin and growth goals.

04

Creative system

Modular assets produced per platform with a standing test calendar, win conditions and retirement rules for decaying performance.

05

Audience architecture

Exclusions, suppressions and overlap management so campaigns complement each other instead of competing for the same impressions.

06

Blended reporting

One view of total advertising efficiency reconciled against your own revenue, with platform figures shown as diagnostics rather than truth.

04
What is changing through 2026

Four shifts in advertising

Automation absorbed most of the manual optimisation work. What remains is strategy, creative and measurement — which is where the difference now lives.

01

Platforms automate the buying

Bidding, placement and increasingly targeting are handled by the platform better than manual management. The operator's value moved entirely to inputs: creative, audience definition, conversion signals and budget allocation.

02

Creative volume became the constraint

Automated systems need creative variety to optimise against. Accounts producing a handful of assets a quarter starve the algorithm and underperform accounts with systematic production.

03

Signal quality decides performance

What you feed back as a conversion determines what the platform optimises toward. Sending low-quality signals — all leads rather than qualified ones — trains it to find more of the wrong people.

04

Retail and connected TV are opening up

Retail media networks and CTV now offer targeting and measurement that were previously unavailable, and are frequently less competitive than saturated search and social auctions.

05
Why Sachkhand

PPC accountable to your margin, not to a dashboard

The target comes from what you can afford to pay for a customer, not from what a platform says it achieved.

Targets set from margin

We start with what a customer can cost and stay profitable. Platform ROAS is a diagnostic, never the goal — it can be excellent while the business loses money.

Deduplicated, blended reporting

One honest number for total advertising efficiency, reconciled against your own revenue rather than summed from platform dashboards.

Channel roles respected

Prospecting judged on new customers, not last-click ROAS. Measuring demand creation like demand capture defunds your growth engine.

Creative at volume

Systematic production and testing, because automated platforms need variety to optimise against and creative is now the main performance lever.

We recommend cutting spend

If a channel is not incremental we say so, even though it shrinks the budget we manage. Managing ineffective spend is not a service worth buying.

Coordinated with organic

Paid planned alongside SEO so you are not buying clicks for terms you already rank first for — a common and entirely avoidable waste.

06
The Honest Comparison

Why Businesses Choose SDM for Advertising

Same budget, very different outcomes. Point by point, here’s how a specialist partner compares to a typical agency or going it alone.

What actually matters With SDM Typical Agency In-House / DIY
Senior specialist on your accountAlwaysOften a juniorStretched thin
Custom strategy built for your goalsTailoredTemplatedGuesswork
Deep audit before any work beginsSurface-levelSkipped
White-hat, penalty-safe methodsGuaranteedVariesHigh risk
Plain-English reporting tied to revenueMonthlyJargon PDFsNone
Direct access to your specialistAccount-manager relayN/A
Targets set from your marginPlatform ROASGuesswork
Deduplicated cross-channel reportingSummed dashboardsPer platform
Channel roles definedAll judged alikeUndefined
Creative tested and retiredRun till deadSet and forget
Audience overlap managedUnauditedUnknown
Ongoing competitor gap analysisOne-offManual
Conversion-focused, not just trafficTraffic-firstUnclear
Premium tools included (Ahrefs, SEMrush)SometimesCostly extra
No long lock-in contractsFlexible6–12 mo lock-inN/A
Established agency, operating since 2017VariesLearning curve
Fast onboarding & early quick wins~2 weeksSlowTrial & error
Human, SEO-led content (no AI spam)Outsourced / AI spamTime-heavy
Focus on compounding, long-term ROICore promiseShort-term winsSlow & ad-hoc
Recovery from Google penaltiesSometimesVery hard

20 reasons growing brands make the switch. See the difference for yourself →

07
Measurement

One number: what a customer costs across everything

Platform figures are reported as diagnostics. The headline is always blended and reconciled against your own revenue.

Blended CPA

Total advertising spend divided by total new customers — the figure attribution windows cannot inflate.

Blended ROAS

All spend against revenue in your own systems, not the sum of platform claims.

New vs returning split

How much spend is acquiring customers versus re-reaching existing ones, which is where over-investment usually hides.

Creative win rate

Share of tested assets that beat control, and how fast winners decay with frequency.

Marginal CPA

What the next customer costs as budget scales — the number that identifies where efficient growth stops.

Advertising performance
All channels blended — rolling 90 days
LIVE
Blended ROAS
4.8x
CPA
−41%
New customer
68%
Creative win
44%
Overlap
−94%
↑ 4.8x blended ROAS vs 2.2x at start
08
The engagement

Four stages, repeated every month

Set the target from margin, fix measurement, cut waste, then scale.

01

Set the target

What a customer can cost given your margin and repeat rate. This becomes the single number every channel is held to, replacing per-platform ROAS goals.

→ Commercial target, not a vanity one
02

Fix measurement

Server-side tracking, deduplication and blended reporting built before optimisation. The honest baseline is usually below what platforms were claiming.

→ Numbers you can act on
03

Cut and restructure

Overlapping audiences separated, fatigued creative retired, non-converting placements removed and channel roles assigned.

→ Same output, less spend
04

Test & scale

Standing creative programme and sequenced audience expansion, tracked against marginal CPA so scaling stops before efficiency collapses.

→ Verified, profitable scale
09
Outcomes

The targets we set for advertising engagements

Targets we plan against for ecommerce, lead generation, SaaS and multi-location clients after six months.

4.8×
Blended ROAS
From 2.2× at start
−41%
Blended CPA
At equal or higher volume
68%
Spend on new customers
Rebalanced from retargeting
−94%
Audience overlap
Removed in first 60 days

Targets rather than best cases. The largest early gains come from removing waste and overlap rather than improving campaign performance — so results are biggest on accounts that have run unaudited for a long time. These are planning targets rather than a record of past client averages; we agree a realistic range against your own baseline before an engagement starts.

10
Scenarios

Advertising in action — three sectors

Different models, the same method: one target, honest measurement, deliberate channel roles. The scenarios below are composites drawn from situations we encounter repeatedly — they illustrate method, not the account of any single named client.

Ecommerce

Three channels, one customer, counted three times

Challenge

Search, social and display each reported strong ROAS. Combined, they claimed substantially more revenue than the business actually recorded.

What we did

Built deduplicated blended reporting, set one CPA target from gross margin, separated overlapping audiences and rebalanced toward prospecting.

4.9×
Blended ROAS
−44%
Blended CPA
Lead generation

Optimising toward the wrong leads

Challenge

Campaigns fed all form fills back as conversions, so platforms optimised for volume. Sales quality had been declining for months.

What we did

Connected CRM outcomes so only qualified leads counted as conversions, then let the platforms re-optimise against that signal.

+112%
Qualified leads
−29%
Cost per SQL
Multi-location

Locations bidding against each other

Challenge

Fourteen locations ran independent campaigns with overlapping radius targeting, inflating auction costs in shared areas.

What we did

Consolidated into a governed structure with geographic exclusions, shared creative library and per-location budget rules.

−38%
Cost per booking
+64%
Total bookings
11
Questions

The questions we get asked most

Direct answers on PPC channel mix, measurement and what paid media should be held to.

What does a PPC agency actually do?+

Three things that matter: decide where the money goes across channels, control what each channel is allowed to buy, and reconcile what the platforms report against what your accounts actually received. Everything else — creative production, bid management, reporting — follows from those. An agency that only does the third is a reporting service.

Which channels should we advertise on?+

It depends on your margin, buying cycle and where demand already exists. Rather than assume, we start from what a customer can cost and work backwards to which channels can deliver at that price. For most businesses that means search for capture and one social platform for prospecting, before anything else is added.

Why is our reported ROAS so much better than your blended figure?+

Because each platform counts conversions its pixel touched, so the same customer gets claimed by several networks. Summed, reported revenue routinely exceeds real revenue. Our blended figure divides all spend by actual customers from your own system — a lower number, and the only one that reflects the business.

Should we be running retargeting?+

Usually some, and almost certainly less than you are. Retargeting reaches people who already decided, so it reports excellent returns while frequently adding little incremental revenue. A holdout test settles it in a few weeks. In most audits we find retargeting over-funded and prospecting starved.

How much creative do we need?+

More than most businesses produce. Automated platforms need variety to optimise against, and performance decays with frequency. A handful of assets per quarter starves the system. We build modular production so variations can be generated quickly without a full shoot each time.

What is signal quality and why does it matter?+

It is what you feed back to the platform as a conversion. If you count every form fill, the algorithm finds more form fills — including unqualified ones. Connecting CRM outcomes so only genuinely qualified leads count changes what it optimises toward, and it is frequently the single highest-impact fix in lead-generation accounts.

Can you work alongside our existing agency?+

Yes, though it limits the main benefit. The value comes from allocating between channels against one target, which needs someone seeing the whole picture. If another agency runs a channel, we can still manage the rest and provide blended reporting — but split ownership tends to reintroduce the siloed optimisation we are trying to remove.

How quickly will we see improvement?+

Waste and overlap reduction shows within thirty to sixty days and often funds the engagement. Creative testing compounds from month two or three. Incrementality testing needs a few weeks per test, so a complete picture of what your spend genuinely causes typically takes a quarter.

Next step

Ready to know what your PPC spend really earns?

We will reconcile what your platforms report against your actual revenue, find the overlapping spend, and model what one blended target would change.

Free multi-channel audit
Attribution reconciliation
Audience overlap analysis
Margin-based target model
BLENDED ROAS4.8x
Chat With Us
🚀 Book Free Audit & consultation!
45 min · Free audit + strategy + consultation · No obligation