Landing Page Optimisation Services at a glance
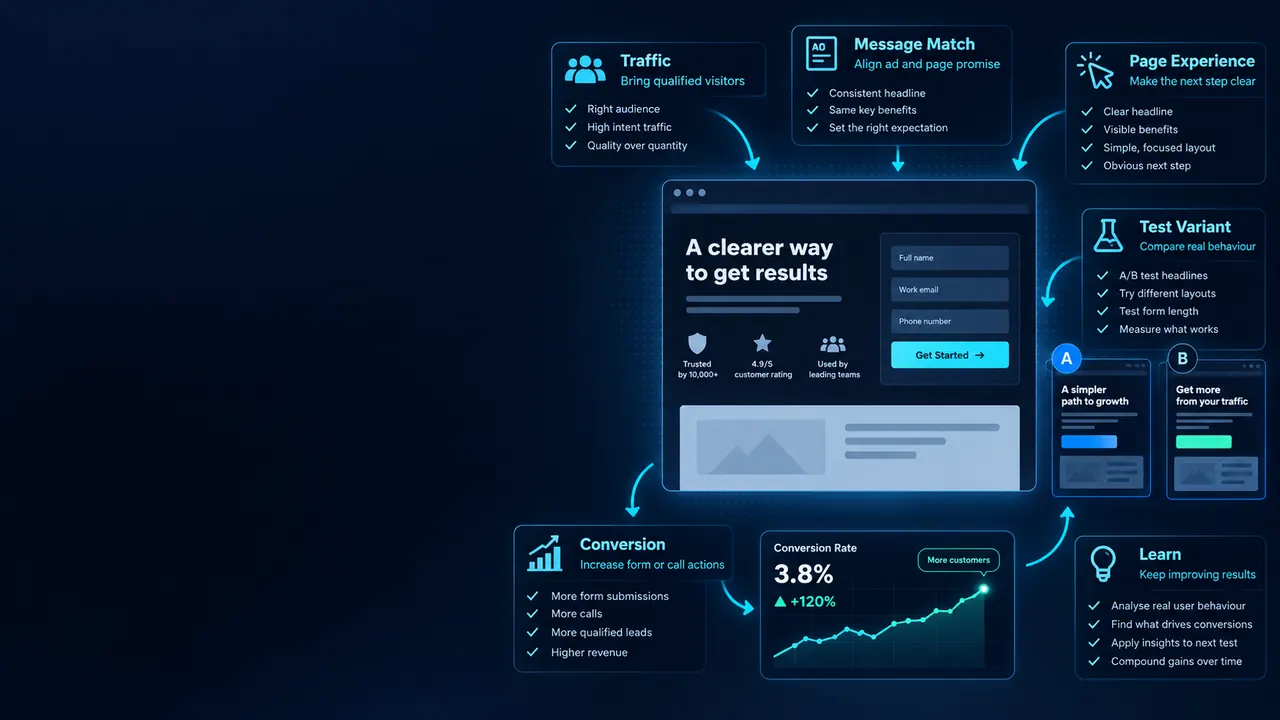
Our landing page optimisation (landing page optimization) and CRO services turn paid and organic traffic into enquiries. We improve landing page conversion through message match, speed, form design and structured A/B testing — conversion rate optimisation measured on cost per lead.
Get a free audit →- Conversion audit
- Message match
- A/B testing
- Form optimisation
- Page speed
- CRO reporting
The traffic is fine. The page is asking too much, too early
Most underperforming landing pages fail for the same handful of reasons: the page does not say what the ad said, the form asks for more than the offer is worth, it is slow on the phone where most of the traffic is, and nothing on it makes an unfamiliar company look safe to contact. None of those are fixed by buying more traffic.
No message match
The ad promised something specific and the page shows a generic homepage. The visitor cannot tell they are in the right place and leaves.
Forms that ask too much
Eleven fields for a first enquiry. Every additional field costs completions, and most of them are never used by anyone.
Slow on mobile
Field performance rather than a lab score. Most paid traffic is mobile and a page that takes seconds to become usable loses the visit before it is read.
No reason to trust
No reviews, no real photography, no address, no named people. For an unfamiliar company that absence is enough to stop an enquiry.
Fix the obvious, then test the rest.
A meaningful share of the gain comes from things that do not need testing at all — matching the page to the ad, cutting the form to what you actually use, making it fast on a phone, and putting genuine proof where the decision happens.
Then structured testing on what remains, with enough traffic to reach a real result rather than calling a winner after two days on a difference that is noise.
- Buy more traffic
- Ads point at the homepage
- Long forms, everything required
- Lighthouse score
- Test button colours
- Winner called in two days
- Convert the traffic you have
- Page matches the ad
- Only fields you actually use
- Field data at the 75th percentile
- Test offer, message and structure
- Run to significance
going from 2% to 4% conversion halves your cost per lead across every channel at once, permanently, with no increase in media spend. Buying the same result through traffic means doubling the budget.
- Message match
- The page reflects the ad or query that brought them, so there is no gap between what was promised and what appears.
- Form reduction
- Every field justified against whether anyone uses it. Progressive capture for the rest, asked once there is a relationship.
- Mobile performance
- Measured on field data at the 75th percentile, because that is what visitors experience and what Google uses.
- Proof where the decision happens
- Reviews, real photography, credentials and named people placed next to the call to action rather than buried on an about page.
- Structured testing
- One meaningful change at a time, run to significance, with results documented so nothing gets retested a year later.
How pages get rebuilt
Six steps. The first three usually deliver most of the improvement.
Behaviour analysis
Where people stop — scroll depth, field-level drop-off, rage clicks and session recordings on the pages that matter commercially.
Message match audit
Every ad and query mapped against the page it lands on, to find the gaps between what was promised and what appears.
Performance fixes
Core Web Vitals on field data, with the specific elements causing failures identified rather than a general speed pass.


Form rebuild
Fields cut to what is genuinely used, validation made forgiving, and the submission path tested on real devices.
Trust placement
Genuine proof positioned next to the action rather than on a separate page nobody visits.
Testing programme
Structured tests on offer, headline and structure, run to significance and documented so learning accumulates.


We fix before we test
Testing a broken form is a slow way to discover it was broken.
Obvious problems first
Message match, form length and mobile speed usually deliver more than any test, and they need no traffic volume to justify.
Tests run to significance
We will not call a winner on two days of data. Most reported conversion wins in this industry are noise read as signal.
Field data, not lab scores
We optimise what visitors actually experience at the 75th percentile, which is also what Google measures.
Every form field justified
If nobody uses the answer, the field goes. This alone frequently produces the single largest gain on a page.
Real proof only
Genuine reviews and real photography. Invented testimonials are easy to spot and cost more trust than they buy.
Measured on cost per lead
Conversion rate is the mechanism; the cost per qualified lead across every channel is the outcome we report.
Why Businesses Choose SDM for Landing Page Optimisation
Same budget, very different outcomes. Point by point, here’s how a specialist partner compares to a typical agency or going it alone.
| What actually matters | With SDM | Typical Agency | In-House / DIY |
|---|---|---|---|
| Senior specialist on your account | Always | Often a junior | Stretched thin |
| Custom strategy built for your goals | Tailored | Templated | Guesswork |
| Funnel & CRM audit before any spend | ✓ | Surface-level | Skipped |
| Consented, GDPR-compliant data only | Always | Varies | Risky |
| Plain-English reporting tied to revenue | Monthly | Jargon PDFs | None |
| Direct access to your specialist | ✓ | Account-manager relay | N/A |
| Message match audited per campaign | ✓ | Rarely | No |
| Form fields justified individually | ✓ | Left as built | No |
| Field performance data used | ✓ | Lab score | Guesswork |
| Tests run to significance | ✓ | Called early | n/a |
| Reported as cost per lead | ✓ | Conversion % only | Unclear |
| Ongoing competitor offer analysis | ✓ | One-off | Manual |
| Conversion paths fixed before buying traffic | ✓ | Traffic-first | Rarely |
| CRM, tracking & call analytics included | ✓ | Extra cost | Patchy |
| No long lock-in contracts | Flexible | 6–12 mo lock-in | N/A |
| Established agency, operating since 2017 | ✓ | Varies | Learning curve |
| Fast onboarding & early quick wins | ~2 weeks | Slow | Trial & error |
| Human-written offers & nurture copy | ✓ | Templated | Time-poor |
| Optimised to closed revenue, not volume | ✓ | Lead count | Unclear |
| Speed-to-lead process built in | ✓ | Rarely | Slow |
20 reasons growing brands make the switch. See the difference for yourself →
Conversion rate is the mechanism. Cost per lead is the point.
A conversion gain that does not lower acquisition cost has usually just moved traffic around.
Conversion rate by page
Per landing page and per source, because an average across a site hides the pages actually costing money.
Cost per qualified lead
The outcome metric. Conversion improvements should show here across every channel at once.
Form completion rate
Field-level drop-off, which shows exactly where people abandon rather than that they did.
Core Web Vitals by template
Field data at the 75th percentile, split by template rather than averaged into meaninglessness.
Test velocity and win rate
How many tests run and how many produced a real result. Both matter; neither alone is meaningful.

Our Landing Page Optimisation process: four stages, gains inside the first month
Unusually for this work, the early wins do not need a testing programme.
Find the leak
Behaviour analysis, field-level drop-off and message match audit across the pages that carry commercial traffic.
Where it is being lostFix the obvious
Message match, form length, mobile performance and trust placement — no testing required.
First gains, quicklyTest the rest
Structured tests on offer, headline and structure, run to significance rather than called early.
Compounding improvementReport on cost
Cost per qualified lead across channels, because that is what a conversion gain is worth.
Cheaper acquisition
Landing Page Optimisation FAQs: the questions we get asked most
On forms, testing, mobile and what actually moves conversion.
Further reading
Go deeper on this
The thinking behind the work. These guides go deeper on the methods this page describes — written by the team that runs them.
 Web Design
The 2026 CRO Guide: Turning Traffic Into Revenue
The 2026 conversion rate optimization guide: research, value proposition, friction, trust, forms, A/B testing and prioritisation to turn traffic into revenue.
Read the guide Web Design
The 5-Second Website Test: Does Your Site Pass?
The 5-second website test: how to check if visitors instantly understand what you do, how to run it, the questions to ask and fixes that improve conversions.
Read the guide