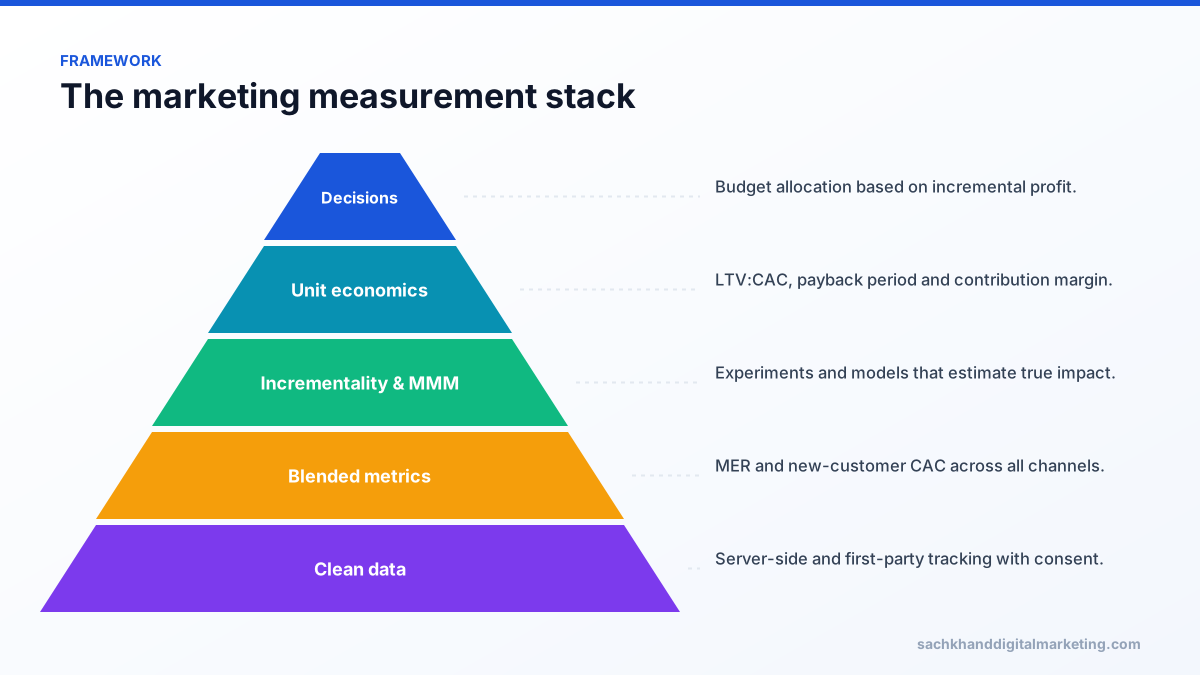
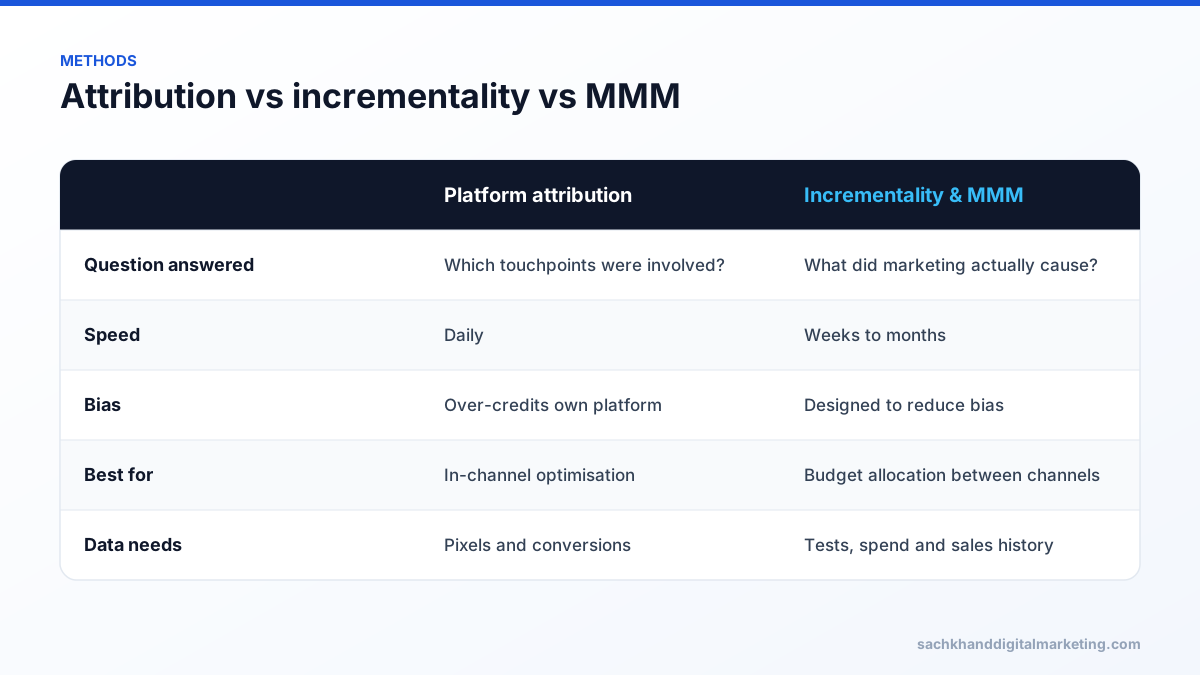
Platform dashboards all claim credit for the same sales, so they cannot tell you what marketing is really worth. A reliable ROI framework combines accurate first-party tracking, blended metrics such as marketing efficiency ratio (MER), incrementality tests that show what would have happened without a channel, marketing mix modelling for bigger budgets, and unit economics such as LTV to CAC and payback period. Use each method for the decision it is best at.

On this page
- Why platform ROAS numbers mislead
- 1. Build clean, first-party tracking
- 2. Use blended metrics: MER
- 3. Consolidate the funnel view
- 4. Incrementality: the question that matters
- 5. Marketing mix modelling for larger budgets
- 6. Unit economics: LTV, CAC and payback
- 7. Build a first-party data foundation
- Putting the framework into practice
- Common mistakes
- Worked example: reading the numbers together
- Choosing the right measurement method for each decision
- A monthly marketing ROI report template
- Measurement for lead generation businesses
- Frequently asked questions
Add up the conversions reported by Google Ads, Meta, TikTok, your email platform and analytics, and the total is often far higher than the sales you actually made. Every platform claims credit for the same customers. When budgets are allocated on those numbers, money flows to channels that are good at taking credit rather than creating demand. This framework explains how to measure marketing return in a way finance teams trust and budgets can rely on. This guide covers MER (marketing efficiency ratio), incrementality testing and marketing mix modeling — the measures that show what your spend genuinely returns.
Why platform ROAS numbers mislead
- Double counting: multiple platforms claim the same conversion.
- View-through credit: platforms count sales from people who merely saw an ad.
- Brand capture: retargeting and brand search campaigns claim customers who were already going to buy.
- Tracking loss: browser privacy controls, ad blockers and consent choices remove data.
- Modelled conversions: platforms estimate missing data with their own models.
1. Build clean, first-party tracking
Accurate measurement starts with data you control:
- Server-side tracking through server-side tagging or platform APIs such as Meta’s Conversions API and Google’s enhanced conversions improves reliability compared with browser pixels alone.
- Consent management that respects user choices and uses Google Consent Mode where required.
- CRM integration so leads are matched to revenue, not just form fills.
- Consistent UTM conventions across every campaign and email.
- Deduplication of browser and server events.
- A single source of truth for orders and revenue, usually your ecommerce platform or CRM.
2. Use blended metrics: MER
Marketing efficiency ratio (MER) is total revenue divided by total marketing spend across all channels:
MER = total revenue ÷ total marketing spend
Because it ignores which platform claims credit, MER cannot be inflated by double counting. Track it alongside new-customer acquisition cost (new customers ÷ total acquisition spend) to see whether growth comes from new or existing customers. When MER holds while spend increases, marketing is scaling efficiently.
3. Consolidate the funnel view
Separate prospecting from retargeting and brand campaigns in reporting. Prospecting creates demand; retargeting and brand search mostly harvest it. Judging both on the same ROAS target starves prospecting and overfunds harvesting, which slowly shrinks future demand.
4. Incrementality: the question that matters
Incrementality asks what would have happened if you had not run the marketing. It is measured with experiments:
| Method | How it works | Best for |
|---|---|---|
| Conversion lift tests | Platform randomly withholds ads from a control group | Meta, Google and other large platforms |
| Geo holdout tests | Pause or change spend in selected regions and compare with similar regions | Any channel with regional targeting |
| Time-based tests | Pause a channel for a period and measure the change | Smaller budgets, with care for seasonality |
| Audience holdouts | Exclude a random share of customers from emails or retargeting | Email, SMS and retargeting |
Brand search and retargeting are often the first places incrementality tests reveal overspend, because they capture people who were already close to buying.
5. Marketing mix modelling for larger budgets
Marketing mix modelling (MMM) uses statistical models on historical spend, sales and external factors such as seasonality and pricing to estimate each channel’s contribution. It does not rely on user-level tracking, which makes it resilient to privacy changes. Open-source tools such as Meta’s Robyn and Google’s Meridian have made MMM more accessible. MMM needs a meaningful history of spend variation and works best when calibrated with incrementality tests.
6. Unit economics: LTV, CAC and payback
- Customer lifetime value (LTV): the gross margin a customer generates over their relationship with you, not just revenue.
- Customer acquisition cost (CAC): total acquisition spend divided by new customers.
- LTV:CAC ratio: many businesses aim for around 3:1 as a healthy benchmark, though the right ratio depends on cash position and growth goals.
- Payback period: how many months until a customer’s margin repays the cost of acquiring them. Shorter payback means growth can be funded from cash flow.
Get a prioritised action plan from our specialists, free.
7. Build a first-party data foundation
Email and SMS subscribers, CRM records, loyalty programmes and customer surveys give you audiences for targeting, data for modelling and insight into why customers buy. Ask new customers how they heard about you; self-reported attribution often surfaces channels such as podcasts, word of mouth and AI recommendations that tracking misses.
Putting the framework into practice
- Audit tracking and fix data quality first.
- Report MER and new-customer CAC weekly alongside platform metrics.
- Run one incrementality test per quarter on your largest or most questionable channel.
- Calculate LTV and payback by acquisition channel or first product purchased.
- Reallocate budget toward channels with the best incremental return at the margin.
- For larger budgets, add MMM and calibrate it with test results.
Common mistakes
- Optimising to platform ROAS without checking blended results.
- Cutting prospecting because retargeting looks more efficient.
- Measuring revenue instead of margin.
- Declaring test results without enough data or with seasonal distortions.
- Changing too many variables at once, making results impossible to interpret.
Worked example: reading the numbers together
Imagine an online store spends $50,000 in a month across Google, Meta and email tools and makes $250,000 in revenue. Platforms together claim $310,000 of attributed revenue.
| Metric | Calculation | Result |
|---|---|---|
| MER | $250,000 ÷ $50,000 | 5.0 |
| Platform-claimed ROAS | $310,000 ÷ $50,000 | 6.2 (over-counted) |
| New customers | From ecommerce platform | 1,000 |
| New-customer CAC | $40,000 acquisition spend ÷ 1,000 | $40 |
| 12-month gross margin per customer | From order history | $110 |
| LTV:CAC (12 months) | $110 ÷ $40 | 2.75:1 |
The platforms suggest a very healthy return, but blended data shows the real picture. A brand search holdout test might then reveal that part of the brand campaign’s claimed revenue would have arrived anyway, freeing budget for prospecting that creates new demand.
Choosing the right measurement method for each decision
| Decision | Best method |
|---|---|
| Which ads or keywords to pause this week | Platform attribution and analytics |
| Whether a channel is worth its budget | Incrementality test |
| How to split annual budget across channels | Marketing mix modelling calibrated with tests |
| How much you can pay for a customer | LTV, margin and payback analysis |
| Whether overall marketing is becoming more efficient | MER and new-customer CAC trends |
A monthly marketing ROI report template
- Total revenue, gross margin and marketing spend.
- MER and new-customer CAC, with trend versus previous months.
- New versus returning customer revenue.
- Channel spend, platform-reported results and notes on attribution caveats.
- Results of any incrementality tests completed.
- LTV and payback period by cohort.
- Budget recommendations for next month.
Measurement for lead generation businesses
For service and B2B companies, the same principles apply with lead stages. Track cost per lead, cost per qualified lead, cost per opportunity and cost per customer; import CRM stages into ad platforms; and calculate payback using average contract value and margin. Self-reported attribution (“How did you hear about us?”) is especially valuable because sales cycles are long and touchpoints are hard to track.
Frequently asked questions
Why are platform ROAS numbers unreliable?
Each platform uses its own attribution rules, counts view-through conversions and models missing data, so several platforms often claim the same sale. They also credit ads for customers who would have bought anyway.
What is marketing efficiency ratio (MER)?
MER is total revenue divided by total marketing spend across all channels. It is a blended metric that cannot be inflated by platforms double counting conversions.
What is incrementality testing?
Incrementality testing measures the additional sales caused by marketing by comparing a group exposed to ads with a similar group that is not, using methods such as conversion lift or geographic holdout tests.
What is a good LTV to CAC ratio?
Around 3:1 is a commonly used benchmark, but the right ratio depends on margins, cash flow and growth strategy. Payback period is just as important for cash-constrained businesses.
When should a business use marketing mix modelling?
MMM is most useful when you spend across several channels with meaningful budgets and have at least one to two years of spend and sales data with enough variation to model.
Want server-side tracking and ROAS-driven scaling done for you?
Talk to our team about your goals. We will show you where the biggest wins are, starting with a free, no-obligation audit.